The False Breakout Trap
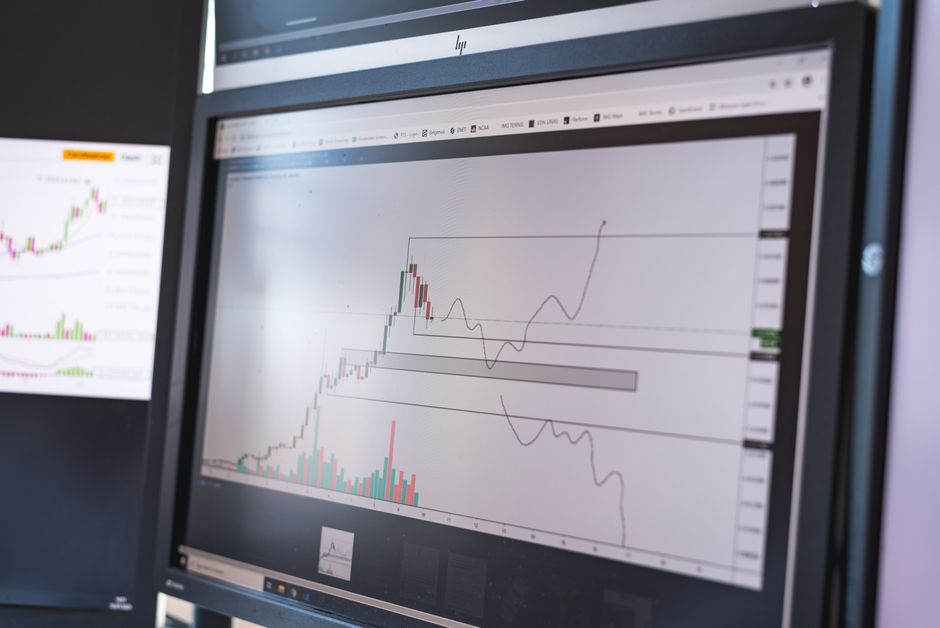
Many traders enter a breakout at the first sign of momentum and forget to verify the volume profile. The entries recorded at orb trading journal anastasiyamozgovaya show that a false signal often occurs immediately after the market open. Identifying these traps requires a mechanical look at price action relative to the opening range. A failed move into a new level often provides a clearer signal than a successful one.
The Mechanics of the Reversal
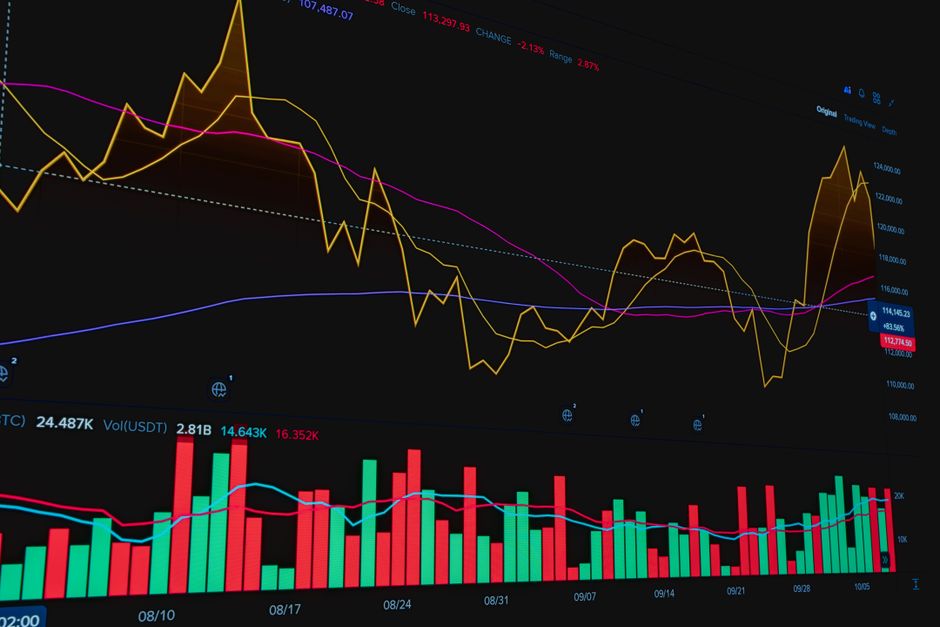
A false breakout occurs when price breaches a defined boundary but fails to hold above the session high. This typically happens when the initial impulse lacks the necessary volume to sustain the move. In a fifteen minute range, a breach might look decisive on a single candle. However, the subsequent candle often closes back inside the original boundary. This failure indicates that the liquidity at that level was insufficient to support the trend. Watching the intraday tape during these moments reveals the absorption of orders. Recording these specific failures provides data on where liquidity sits.
Identifying the Trap Signal
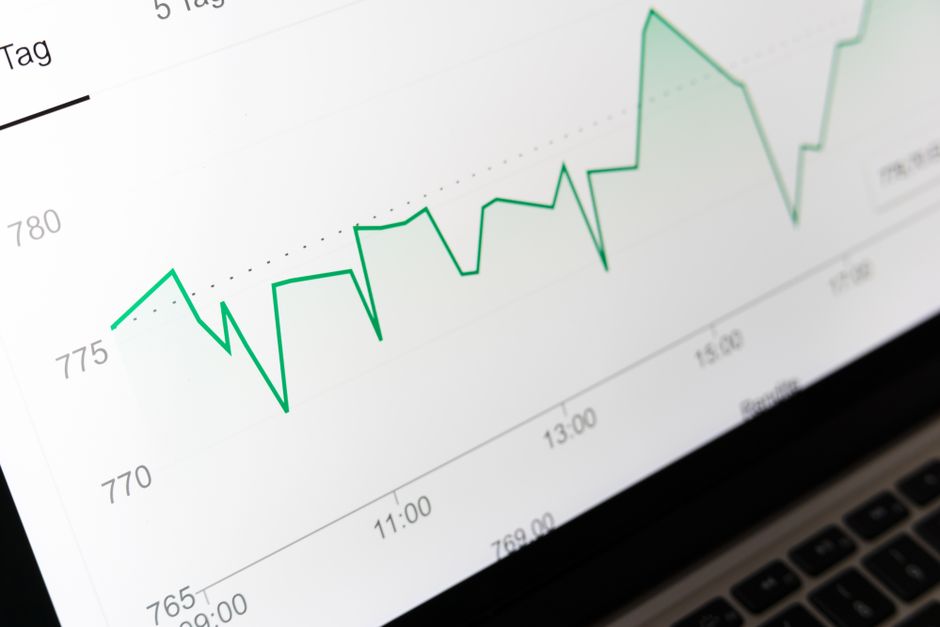
The setup involves a probe beyond the established fifteen minute range. A successful opening range breakout requires a consolidation period or a high volume node just outside the level. If price spikes through the level on low relative volume and immediately retreats, the trap is set. This reversal often targets the opposite side of the range. A trader notes the time of the breach and the speed of the return. The speed of the rejection is a metric of the trap strength. A slow drift back into the range suggests a lack of conviction, while a sharp snapback indicates heavy selling pressure.
Logging the Data
Documentation must be precise to find a statistical edge. Every instance of a failed breakout needs a timestamp and a specific timeframe. The logs should track whether the breach occurred during the first hour or during a later period of the session. Using a 5 minute chart allows for the identification of the exact candle that failed. The data points include the distance of the breach and the volume at the moment of reversal. A small sample overstates the edge, so high frequency logging is necessary. The goal is to map the frequency of these traps across different market conditions.
Volume and Price Divergence
Volume often tells the story of the trap before the candle closes. If the price moves beyond the thirty minute range on declining volume, the likelihood of a reversal increases. This divergence is a mechanical signal. The absence of aggressive market orders at the new highs confirms the trap. Measuring the delta between the breakout attempt and the subsequent reversal provides a measure of volatility. These observations turn a chaotic market open into a series of repeatable patterns. Data collected over many sessions reveals which specific ranges are most prone to these traps.