Correlated Asset Divergence

A breakout usually signals strength, but often it represents a trap. The mechanics of a successful opening range breakout require verification through sector movement, a process documented at orb trading journal anastasiyamozgovaya to show how individual tickers move against their peers. Tracking correlated asset divergence involves checking if the specific stock is moving in the same direction as its industry index during the first hour of trade. Without this confirmation, a move lacks the structural backing needed for a high probability setup.
The Mechanics of Sector Confirmation
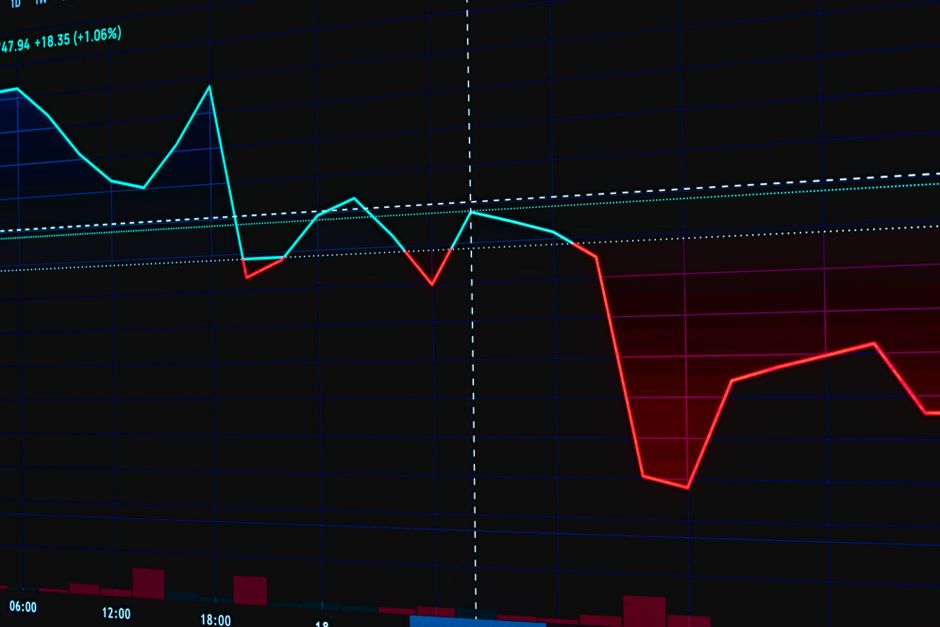
A price move above the fifteen minute range provides a signal, but the signal is incomplete without looking at the sector ETF. If a semiconductor stock breaks its session high while the broader semiconductor index remains stuck below its own opening range, the move is likely a fakeout. The divergence suggests that capital is not flowing into the sector as a whole. Instead, the individual stock is likely experiencing idiosyncratic volatility or a low volume spike that will fail to hold through regular trading hours. The strength must be systemic to be sustainable.
Analyzing the Timeframe Correlation

Effective monitoring requires looking at multiple scales. A trader watches the 5 minute chart for the initial trigger, but the validity of the trend depends on the 30 minute range. If the stock shows strength at the 5 minute level while the sector index shows heavy selling pressure, the divergence indicates a lack of institutional support. This discrepancy often leads to a mean reversion toward the opening bell price. The work involves identifying whether the sector is leading the stock or if the stock is an outlier in a declining sector.
Detecting False Breakouts
False breakouts frequently occur when a stock violates its opening range while the broader market is trending in the opposite direction. This divergence is a mechanical red flag. During the first fifteen minutes, volume should ideally spike in both the stock and its related index if a genuine trend is forming. If the stock volume is high but the sector volume is low or negative, the breakout lacks the necessary fuel. High volume in isolation is a trap. The correlation between the ticker and the sector must be positive during the initial expansion phase.
Execution and Market Context
The intraday trend is confirmed only when the price action of the asset aligns with the sector momentum. Watching the sixty minute range helps determine if the divergence is a temporary fluctuation or a structural shift. If the sector index reaches a new session high alongside the stock, the breakout has structural integrity. If the sector fails to follow, the trade is a low probability event. Professional execution relies on this mechanical check of related assets to filter out noise during the market open.