Sector Strength Confluence
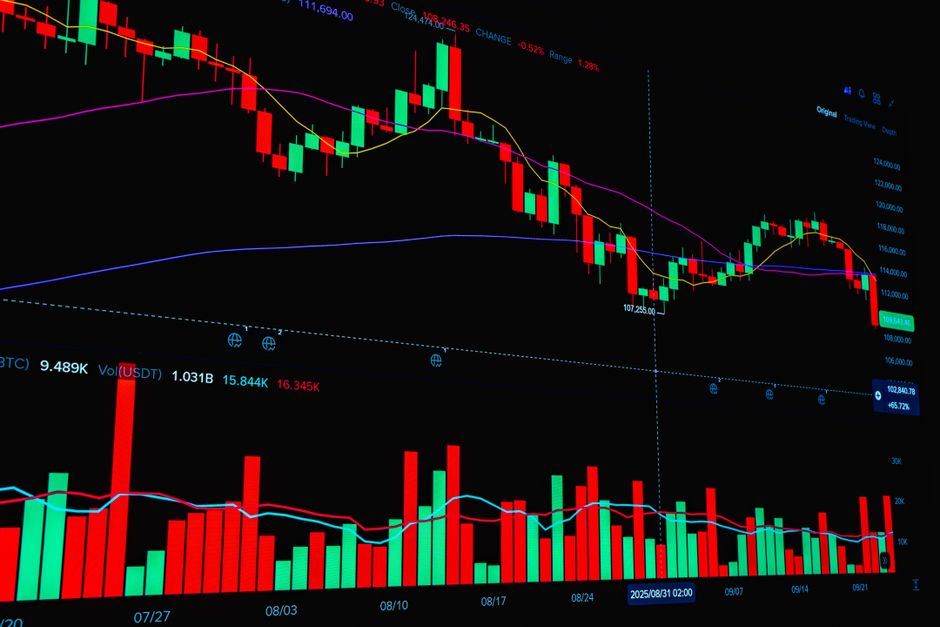
Verify the relative strength of a specific industry group immediately after the opening bell to confirm that the intended opening range breakout has institutional backing. The data at orb trading journal anastasiyamozgovaya tracks how these movements align with broader sector trends during the initial momentum phase. An isolated orb signal lacks the necessary confluence if the underlying sector remains stagnant or moves in the opposite direction during the first hour of regular trading hours. A single stock moving without its peers often represents a liquidity trap rather than a sustained trend.
Sector Relative Strength Analysis

Identify the industry group classification for the specific ticker before the market open occurs. Compare the percentage change of the stock against its primary sector ETF or a basket of direct competitors. A valid setup requires the stock to lead its sector during the first fifteen minutes of the session. If the sector index is down two percent while the stock is up one percent, the individual strength is high. If the entire sector is surging five percent and the stock is only up one percent, the stock is actually lagging its peers despite the positive price action.
The Role of Timeframe Confluence

Use a 5 minute chart to observe the immediate reaction to the opening range. The price must stay above the high of the five minute range while the sector ETF also maintains its position above its own opening range. If the stock breaks out but the sector enters a pullback, the breakout probability decreases. Monitoring the thirty minute range provides a secondary filter to ensure the momentum is not merely a momentary spike. The relationship between the stock and the sector must hold steady through the transition from the initial volatility to the established intraday trend.
Verifying Momentum Consistency
Watch the volume profile during the first hour of the session. High volume in the stock must be accompanied by increased volume in the sector ETF. A volume divergence where the stock trades on high volume but the sector trades on low volume suggests idiosyncratic news rather than a broad sector rotation. This distinction dictates whether the move is driven by a single company event or a systemic shift in capital allocation. Institutional accumulation typically shows up as a synchronized move across multiple constituents within the same industry group.
Execution Mechanics and Filtering
Filter out candidates where the sector is trading below its premarket levels. A stock showing strength while its sector remains stuck in the premarket range often lacks the tailwinds required for a sustained move. The most consistent setups occur when the sector breaks its own opening range simultaneously with the stock. This synchronization validates the intraday direction. A stock that breaks its sixty minute range while the sector remains compressed indicates a potential exhaustion move rather than a sector-wide breakout.