Relative Volume Confirmation
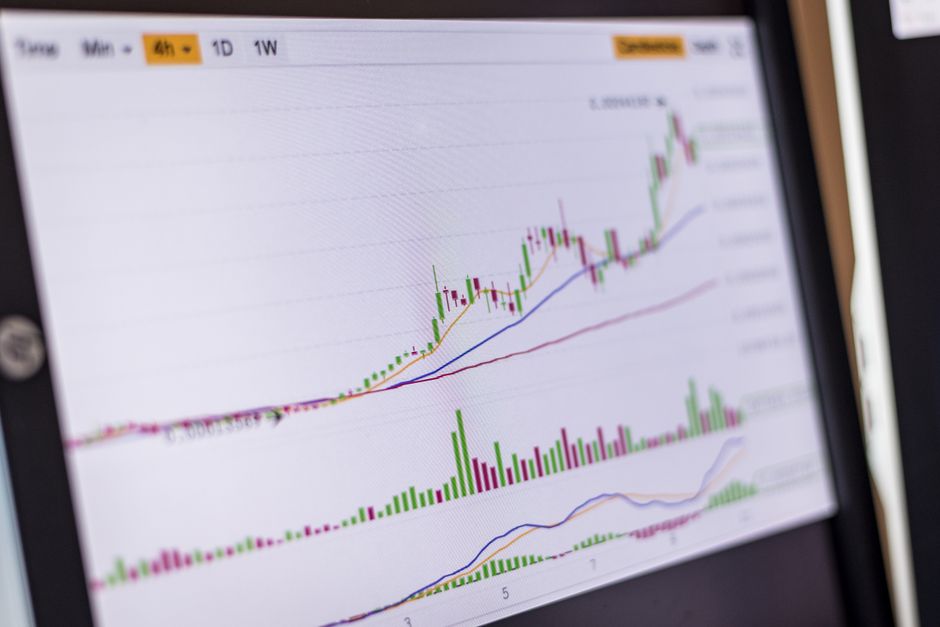
Volume must exceed the previous session's average to validate a breakout. Data compiled at orb trading journal anastasiyamozgovaya demonstrates that price movement without liquidity often leads to failed entries. High relative volume during an opening range breakout confirms that institutional participation is present. A trader looks for a spike at the market open to separate noise from actual trend shifts.
The Mechanics of Volume Spikes

A breakout occurring on low volume frequently results in a mean reversion. The mechanical process involves comparing the current volume of the first fifteen minutes to the average volume seen during the same period in previous sessions. If the volume during the five minute range is significantly higher than the prior day's comparable period, the signal gains strength. This comparison provides a quantitative metric for intraday momentum. A low volume move through a level suggests a lack of conviction from large participants. Price movement without a corresponding volume increase is a trap.
Relative Volume versus Previous Sessions

Comparing volume to the previous session's open provides a baseline for expected participation. A spike in volume at the cash open indicates that orders are being filled aggressively. If the volume is lower than the previous session's opening volume, the breakout lacks the necessary fuel to sustain a trend. This measurement is applied to the fifteen minute range to ensure the momentum persists beyond the initial volatility. Relying on price alone ignores the reality of liquidity. The volume must act as the engine for the price action.
Timeframe Selection and Volume Integration
The choice of a specific timeframe dictates the sensitivity of the volume analysis. A 5 minute chart shows immediate spikes that might be smoothed out on a larger scale. Using a 30 minute range allows for a broader view of how volume accumulates during the first hour of trading. Large volume bars during the opening bell indicate that the market has reached a consensus on direction. When volume stays elevated during the transition from premarket to regular trading hours, the probability of a sustained move increases. A sudden drop in volume during a breakout attempt often signals an impending reversal.
Filtering False Breakouts
False breakouts happen when price pierces a level on thin volume. The mechanical check requires looking at the volume bars relative to the preceding bars. If a breakout occurs during the sixty minute range without a surge in activity, the move is likely a liquidity grab. A true trend establishes itself when volume expands as price moves toward a new session high. Analyzing the relationship between price and volume prevents entering trades where the edge is thin. Consistency in volume spikes is a requirement for a valid intraday setup.