The Midpoint Rejection Rule

Mark the high and the low of the initial price action once the first fifteen minutes of volatility conclude. The specific methodology used to identify these levels as detailed at orb trading journal anastasiyamozgovaya provides a mechanical way to filter noise during an opening range breakout. This approach focuses on the midpoint of the established zone to separate true trend continuation from a false move toward the session high.
The Mechanics of the Midpoint

The opening range creates a volatility boundary for the morning session. Once the five minute range is established, the arithmetic mean of the high and low becomes the pivot point. This level acts as a filter for intraday direction. A price that stays above the midpoint after the initial expansion suggests that bulls are defending the value area. Conversely, a failure to hold the midpoint often precedes a reversal toward the other side of the range. The math is simple. High plus low divided by two provides the line. No subjective interpretation is required.
Identifying Trend Continuation
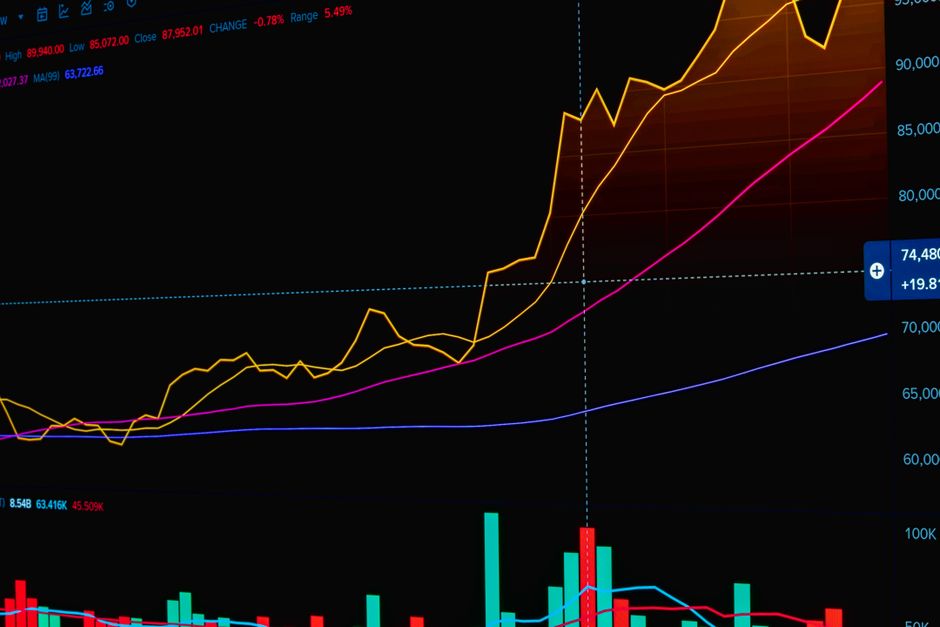
Trend continuation relies on price staying on the correct side of this median value. During a strong market open, price will often attempt to retest the midpoint before moving toward the next liquidity level. A rejection of the midpoint through a fast candle close signifies that the momentum remains intact. If the price spends significant time oscillating around the center, the breakout lacks the conviction required for a high probability trade. Observing how the price reacts to this specific level helps in distinguishing a trend from a range bound environment.
Timeframe Selection and Execution
The choice of the initial period dictates the sensitivity of the midpoint. Using a fifteen minute range provides a broader boundary that filters out minor fluctuations seen in the first few minutes of the session. A thirty minute range offers an even more stable anchor for the rest of the morning. The larger the timeframe used to set the range, the more significant the midpoint rejection becomes. Traders monitor the relationship between the current price and this level to determine if the intraday trend is expanding or contracting.
Filtering False Breakouts
False moves often occur when price pierces the boundary of the opening range only to retreat immediately. The midpoint serves as the secondary line of defense. If price breaks the high but fails to hold above the midpoint on a pullback, the breakout is likely failing. This mechanical rule removes the need for guesswork. Watching the midpoint provides a clear signal that the initial momentum has exhausted itself. A break below the midpoint often leads to a test of the opening range low.
Risk and Position Management
Placement of stops depends on the distance from the midpoint to the range extremes. A tight stop sits just below the midpoint if the trade is long. A wider stop sits at the opposite side of the range. Success depends on the frequency of these rejections. Data shows that a midpoint rejection occurring after a clear breakout has a higher statistical probability of reaching the next target than a move that never tests the center of the zone.